Step 4 - territory map reports
Click here to download the complete files for all steps in this tutorial.
Now we have designed our territories we will want to output sales territory maps in some form. The territories themselves are stored in an Excel spreadsheet and this may suffice for some applications, however we can also use the rich reporting functionality present in ODL Studio to generate a detailed territories report.
Configuring the reporter component to generate reports of territories with maps is quite complex. If the standard reports available here are not suitable for your company you may want to consider hiring us to configure the reporter component for you.
Basic text-only territories report
Select the Area table, right click and from the Component wizard select Reporter. Configure the data adapter as shown in the following screenshot:
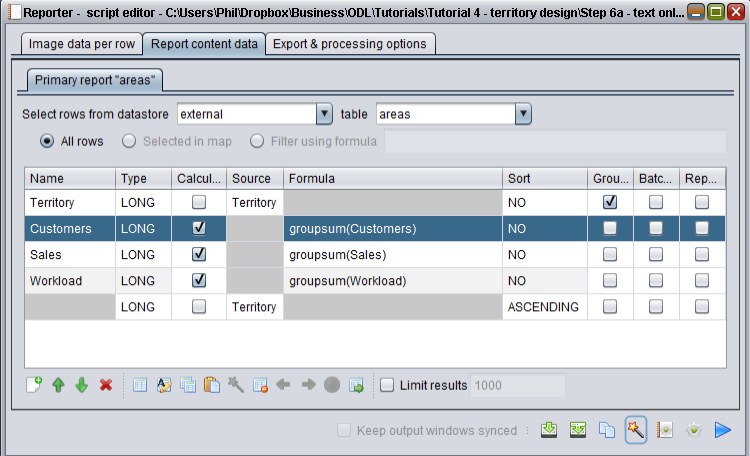
Here we have configured the reporter component to take a group-by query similar to the one developed in the earlier step.
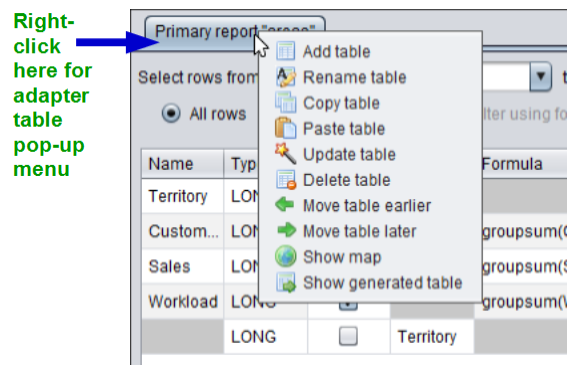
Now rename the report. Right click on the top of the tab where it says Primary report and then select rename table from the pop-up menu:
Alternatively press the rename table button on the toolbar directly below the data adapter. In the dialog that appears, enter Sales territories as the table name. Finally save your script and view the basic portrait report:
- For ODL Studio version 1.0.0, press the wizard wand icon in the toolbar at the bottom right of the script editor and select View basic report (portrait).
- For later versions, select the Export and processing options tab and click the view basic portrait report button.
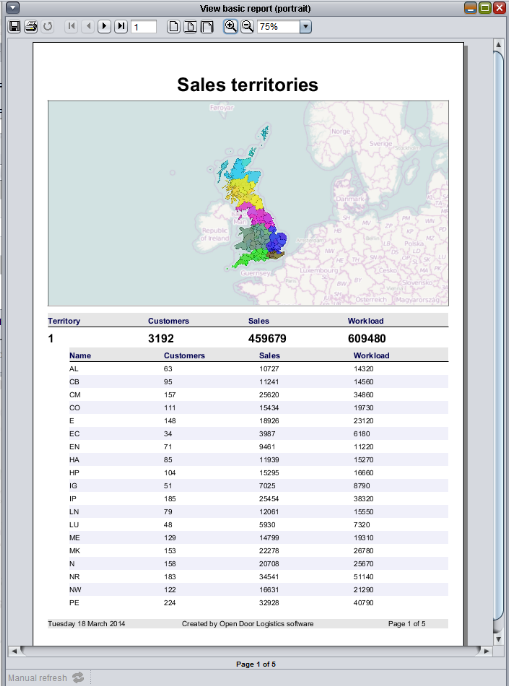
A basic text-only report on your territories will now appear with the title matching the adapter table’s name:

The report is shown in JasperReport’s report control. This control allows you to save the report to pdf, html, word etc…
Adding a header map
We now add a territory map image at the start of this report. In the report content tab, press the add new adapted table button on the toolbar directly below the data adapter, or alternatively right click on the Primary report tab and use the pop-up menu. Remember, if you’re unsure which button is the correct one, you can hover over a button and a tool-tip will appear explaining its function.
In the pop-up box which appears, choose the Areas table for the source table and the Header map for the destination table, by selecting these options in the drop-down lists. Now press OK. You have now added a new special table to the report called the Header map which is populated by adapting the Areas table. Configure the data adapter for Header map as shown in the following screenshot:
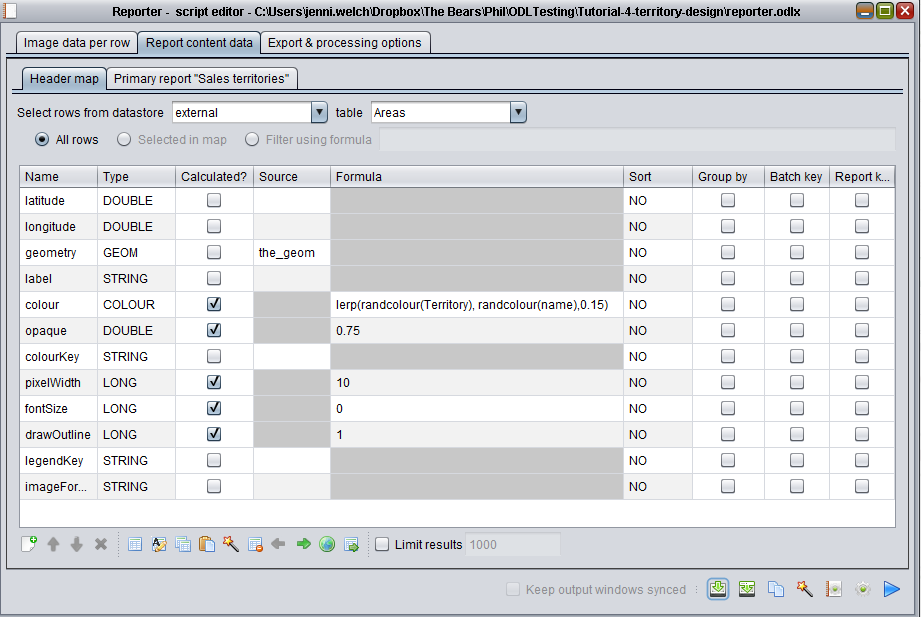
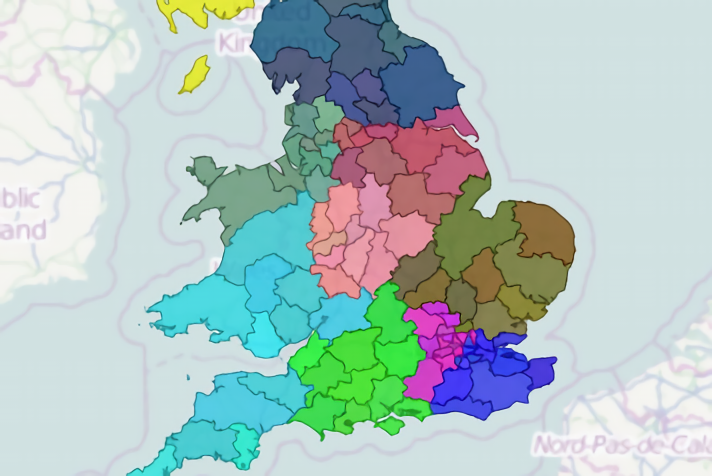
Here we are colouring the building block polygons using the formula lerp(randcolour(Territory), randcolour(name),0.15) which blends two colours together – a random colour based on the territory and a random colour based on the building block’s name. We have also set the building blocks to be partially opaque. Run view basic portrait report again and the following report will appear:
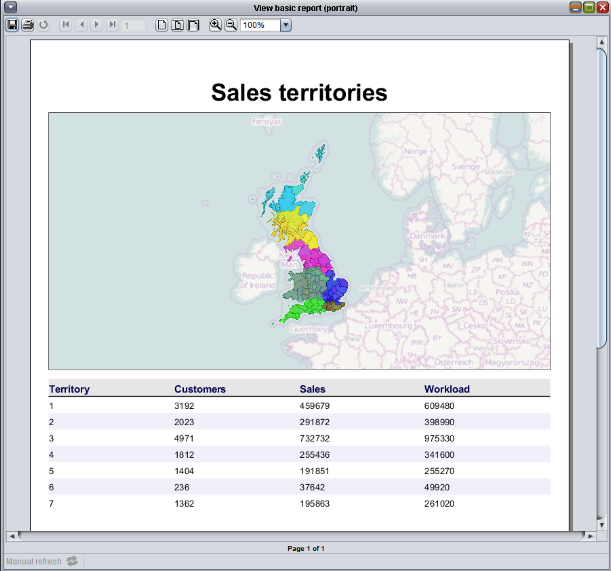
As you can see, each territory has its own colour but the territories map is enhanced by giving each polygon within the territory a slightly different shade.
Add building blocks subreport
We now add details of the building blocks comprising each territory using a subreport. A subreport is a secondary report embedded within the main report. Each constituent report – the main report (primary report) and the subreport – will have its own data adapter table. On each data adapter table you set a column to be the report key, which links the primary report to the subreport. When the primary report is built, each time the reporter component outputs a row for a territory, it uses the report key to select the matching rows from the subreport for this territory - i.e. the subset of building blocks polygons within the territory.
Add a new adapted table again – either using the toolbar or by right-clicking on the adapted table’s tab at the top and using the pop-up menu. Select the source table to be Areas and select the destination table to be Report details. A new tab will now appear in the same tab list as your header map tab and your sales territories tab. Rename the new table to Areas, by right-clicking at the top of the new tab and selecting rename table from the pop-up menu.
The ordering of these tabs determines what they do in the report - the first adapter table is always the primary report and the later adapter tables are the subreport(s). You will therefore see that one tab is called Primary report … and another is called Subreport …. (If both tabs start with Primary report … then you have probably forgotten to rename your first data adapter to Sales territories - data adapters with the same table name are actually added together, like an SQL union query).
If your new table is appearing as the primary report and not the subreport, you need to move it to the right. Right-click on the new table’s tab to bring up the pop-up menu and select move table later, or use the left and right arrows in the toolbar below the data adapter grid.
Now configure the data adapter for the subreport as follows:
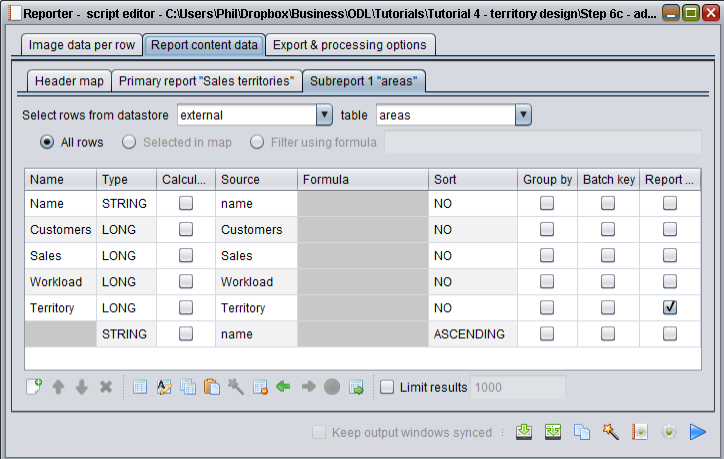
Note that we have (a) ticked the report key box for the territory column and (b) are sorting on area name. Now navigate back to the primary report by clicking on its tab and tick the report key box for its territory column, so the data adapter should look like the following:
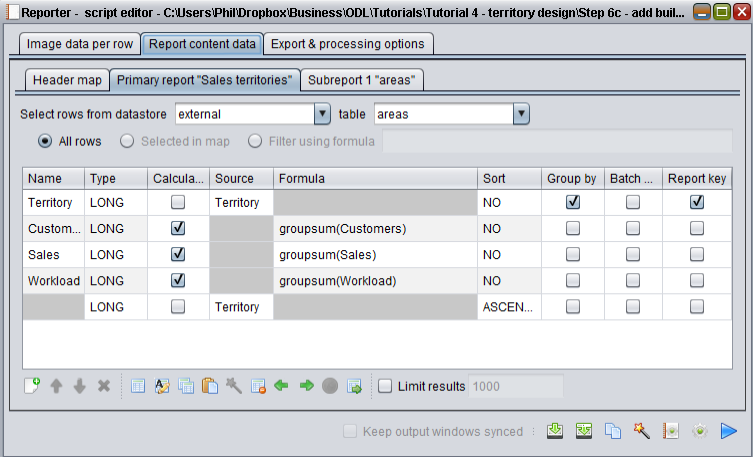
Setting the report key for the territory column on both the primary report and the subreport links the two reports together. Now save your script and run view basic portrait report; a report like the following should appear:
As you can see, the building blocks for the first territory are now listed directly below it.
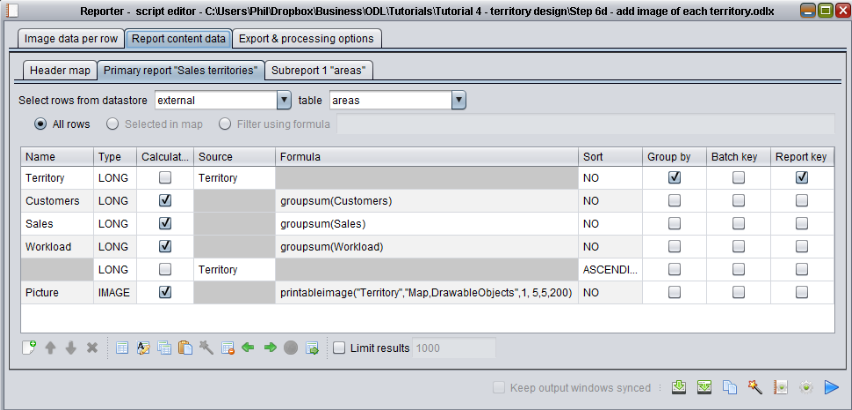
Add map image of each territory
We now add a zoomed-in map image of each individual territory to the primary report. Thus-far we have only edited the contents of the script under the Report content data tab at the top of the script editor dialog, which contains – surprisingly enough – the contents of the report. This content can however also pull-in image data – i.e. maps – which is defined under the image data per row tab (called just map in later versions of ODL Studio). You can add an image field to the report which is calculated using the functions image or printableimage. image. These functions use the data adapter(s) defined under image data per row.
Click on the image data per row tab and you should see the following:
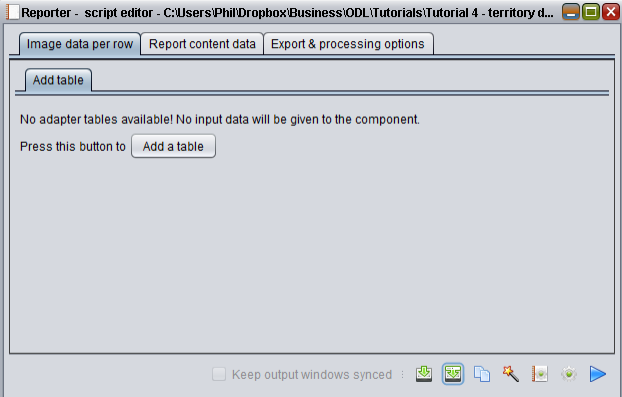
Click the add a table button and in the dialog which appears select the Areas table as the source table and DrawableObjects as the destination table. Configure the data adapter as follows:
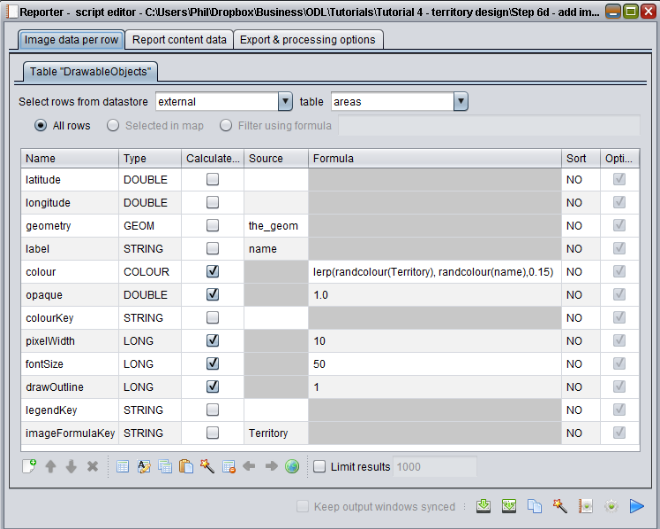
In this data adapter we have:
- Used the same formula for colour as in the header map, so the building blocks will have the same colour in our header map and our smaller maps.
- Set the label so we can see the name of the postcode area on the map.
- Set the column imageFormulaKey to use the area table's territory column. ImageFormulaKey is used in the
imageandprintableimagefunctions to select the subset of polygons corresponding to the current territory.
Now do the following steps:
- Click on the report content data tab at the top of the dialog.
- Select the primary report tab.
- Add a new field (using the add field button directly below the data adapter).
- Rename the field to Picture.
- Set the field's type to be image (using the drop-down menu available by clicking on the type).
- Set the field to be calculated by ticking the box.
- Enter this formula for the field:
printableimage("Territory","Map,DrawableObjects",1, 5,5,200)
Tip – if you have done the previous steps correctly this formula should already be available in the drop-down menu which appears when you click on the formula box.
Your primary report data adapter should now appear as follows:
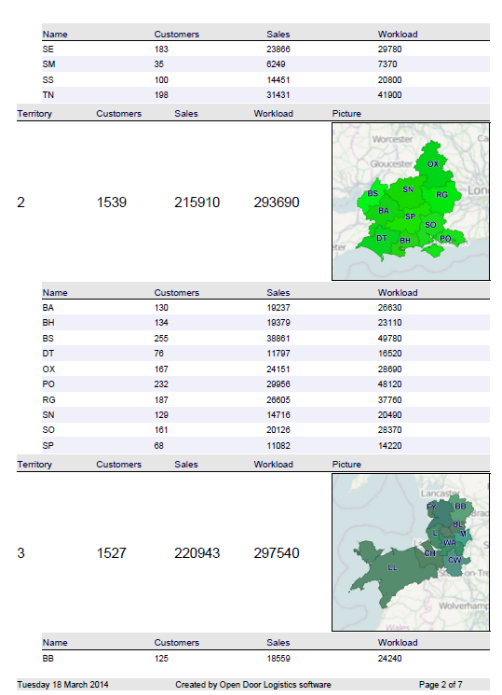
The formula printableimage generates an image with dimensions defined by a physical width and height in centimetres and a value for dots-per-centimetre. You can examine its definition for more details (see the function list available under ODL Studio’s help menu). Save your script and from the wizard select View basic report (portrait); the report should now contain images of each territory (page 2 shown):
Finally to finesse the report for each per-territory map image we will also draw the surrounding territories, but greyed out. We do this by adding two different images together, where one image is greyed out using the function colourimage. Change the Picture column’s formula to:
colourimage( printableimage("Territory","Map,DrawableObjects",6, 5,5,200),colour(0.85,0.85,0.85,0.8),0.8) + printableimage("Territory","Map,DrawableObjects",4, 5,5,200)
If you view the basic report you should now see the following (page 2 shown):
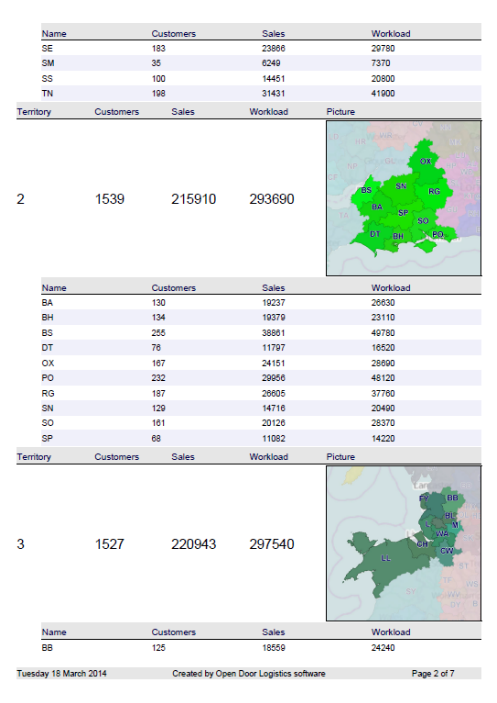
All territory polygons are shown in each image but the polygons outside of the current territory are greyed out.
Editing the layout in Jaspersoft studio
You can follow the same steps laid-out in the reports tutorial to export the .jrxml files and then edit the report design in Jaspersoft Studio, This time two .jrxml files will be output – one for the primary report and one for the subreport. Recompile both reports if you make any changes to them and set the compiled report template (under export and processing options tab) to point towards the compiled .jasper file for the primary report.
In this tutorial’s zip file archive you will find edited reports – both the uncompiled .jrxml file and the compiled .jasper file – for the primary and subreport, together with the final territories report.pdf file generated by them. Try these reports out for yourself by setting the compiled report template to Territories.jasper and then playing the script.