Step 2 - manual territory design
Click here to download the complete files for all steps in this tutorial.
Configure territory painting
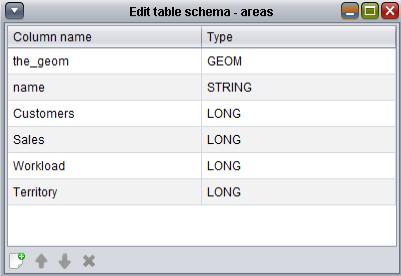
In this step we show you have to configure territory mapping and from this, configure territory painting. Firstly, right-click on the Areas table in the tables list and select Edit table schema. Add a new column named Territory and set its type to be long. This column will hold the id of the territory each area is assigned to. Your schema should now appear as follows:
Select the Area table in the tables list, right click and from the Component wizard, select Show map and set the data adapter up as follows:
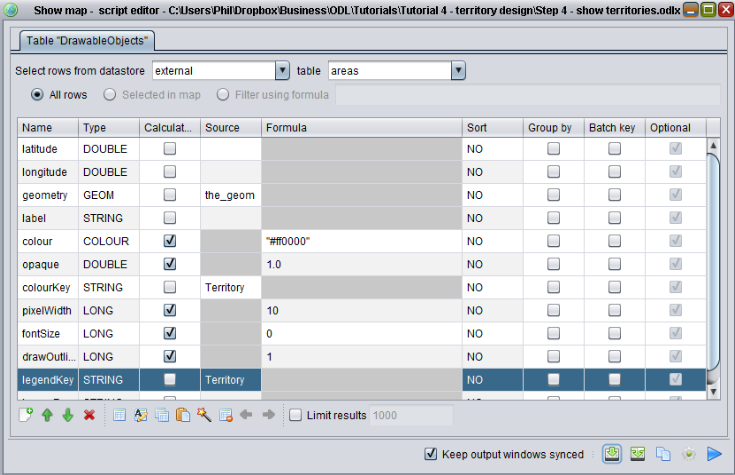
Ensure that you tick keep output windows synced. Note we have set the Territory field to be the source for both the colourKey and legendKey columns. The colourKey column generates a random colour based on the input value; by setting Territory as its source all building block polygons with the same territory will have the same colour. The legendKey field is used to determine the text shown in the legend; using this we can generate a map legend telling us which colour is used for which territory.
If you run the script by pressing the play button the map will appear with the postcode area building blocks coloured in the default colour (as no territory is set), as per the following screenshot:
In ODL Studio versions later than 1.0.0, the default colour is grey, not red.
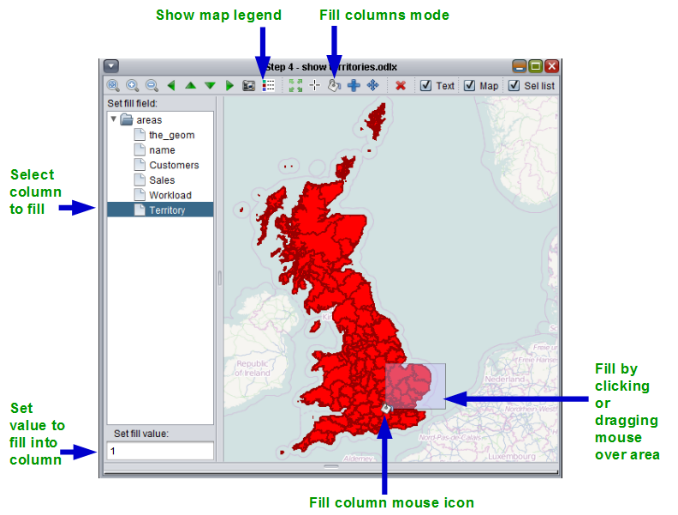
Enter fill columns mode by clicking on the paint-pot icon on the toolbar at the top (see screenshot). The mouse icon should switch to the paint-pot icon and the fill columns panel should appear on the left. In the fill columns panel select Territory as the column to be filled and set the fill value as 1.
You will now paint some territories. Remember you can zoom into the map with the mouse wheel and move around to see different parts of the map. You can also make the map larger by resizing the window.
Place the mouse over the map area, left-click and drag a rectangle over a region containing a few postcode area polygons. When you release the mouse all polygons in the region will have their the Territory column set to 1. This makes their colour change - as we set the colourKey field to use the Territory field. You can also left-click on individual polygons to set their territory. Once you have decided which polygons should be in territory 1, change the fill value to 2 and then paint more areas to define territory 2. Also remember if you make a mistake when painting, you can always undo it.
In this manner, you can visually design territories simply by painting them on the map. If you need to navigate around the map whilst painting, remember you can use the cursor keys on your keyboard to navigate instead of switching the mouse mode back to pan and then back again to paint.
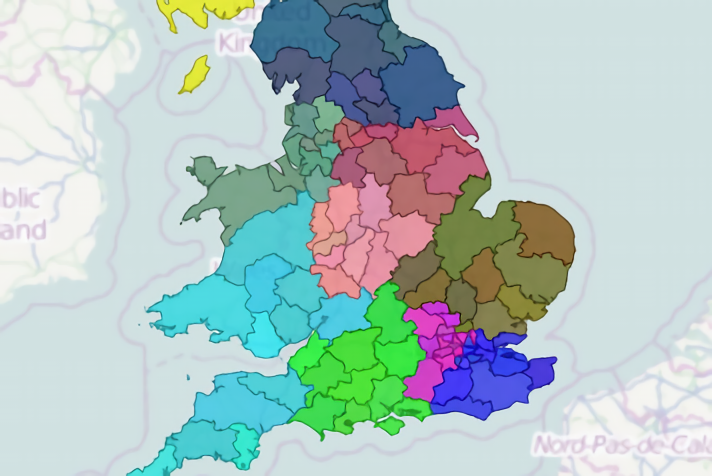
The following screenshot shows a set of territories designed by painting them:
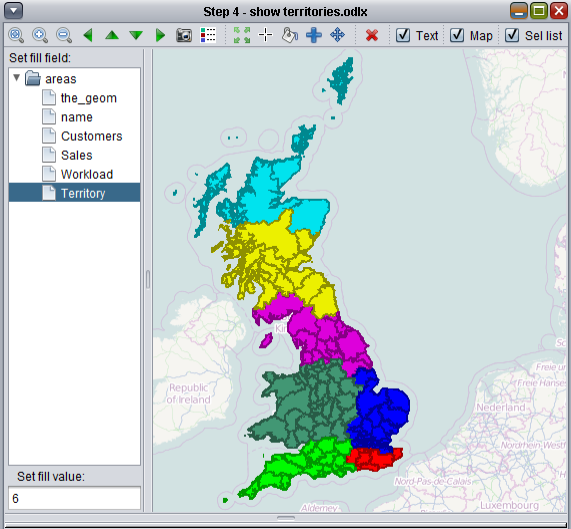
If you press the show map legend button a legend will appear showing which colours are used for which territory ids. From ODL Studio version 1.1.0 onwards, the legend control also allows you to zoom on a territory or choose which territories to show or hide.
We show you how to create detailed sales territory maps in the later steps, however if you want to quickly capture an image of your territories, you can simple (a) take a print screen of this map or (b) if you want a higher resolution or larger sales territory map image, press the camera button and then configure the image capture dialog.
When designing territories we also need to know various key figures such as amount of sales or workload per territory. We therefore configure two more components.
Configure statistics table
Select the Area table in the tables list, right click and from the Component wizard, select Query table (show table in ODL Studio versions 1.0.0 and later) and set the data adapter up as follows, ensuring that you tick keep output windows synced:
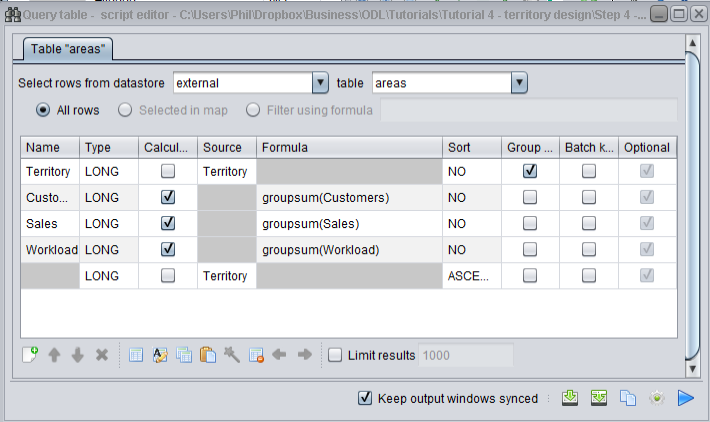
This adapter is configured to run a query similar to an SQL group-by query. Using this configuration:
- The input rows are grouped by the Territory column, as its group-by box is ticked.
- The output Customers, Sales and Workload columns are calculated as the sum of Customers, Sales and Workload for all areas within the same territory.
- The output rows are sorted in order of ascending territory number.
If you press play on the script, a table will then appear showing the figures for each territory:
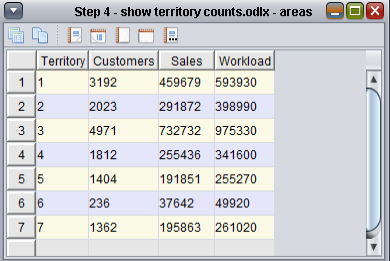
As you sorted by territory in the data adapter, territories are shown in the correct order in the output table.
As you ticked the keep output windows synced box, the numbers in this table will be updated whenever you paint a territory. Using the undo and redo buttons, try undoing and then redoing your painting to see these numbers change.
Configure statistics barchart
Select the Area table again, right-click and from the Component wizard select Barchart and in the dialog that appears, select Launch wizard ‘Barchart with 2 series’. The barchart script editor should now appear; set-up the data adapter up as follows, ensuring that you tick keep output windows synced:
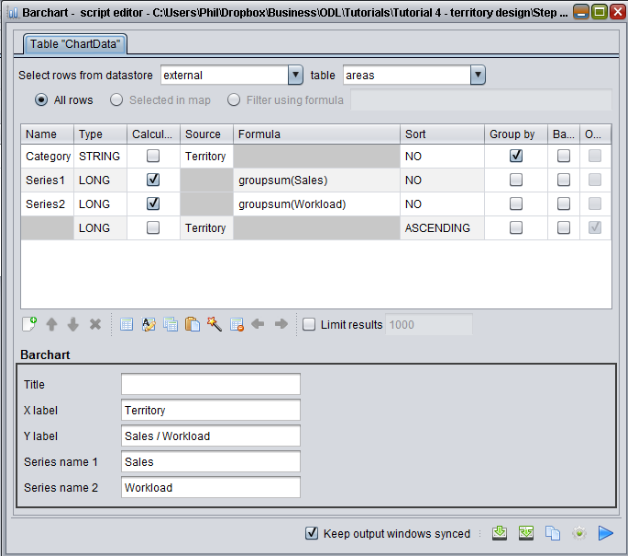
A barchart expects an input category field (in our case, the territory) and one or more values to show for each category, which are passed to it as columns named Series1, Series2, etc… We set Sales to be our first series and Workload to be our second.
In the barchart configuration below the data adapter, we tell the barchart component (a) the titles for the X and Y axes and (b) the name of the two series. If we now press play, a barchart will appear showing sales and workload for each territory:
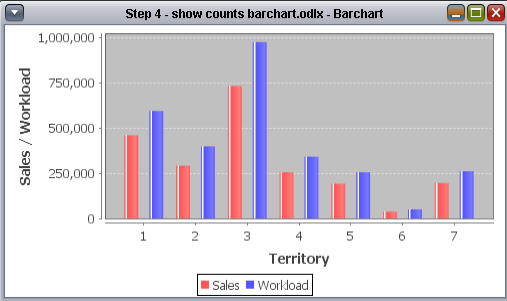
Using the barchart you can clearly see that in our example, territory 3 has both more sales and workload than the other territories. We can use the painting tool to move areas from one territory to another and the table and barchart will automatically update with the new figures. In this way we can manually balance the territory workload whilst simultaneously inspecting the territory shape and geographic distribution using the map.
Tip – you can arrange your map, barchart and numbers windows on-screen as you like and the next time you open ODL Studio they will still be in the same position.